The Point of Sale includes a Dashboard showing your recent sales performance.
The Dashboard is opened from the Point of Sale menu:

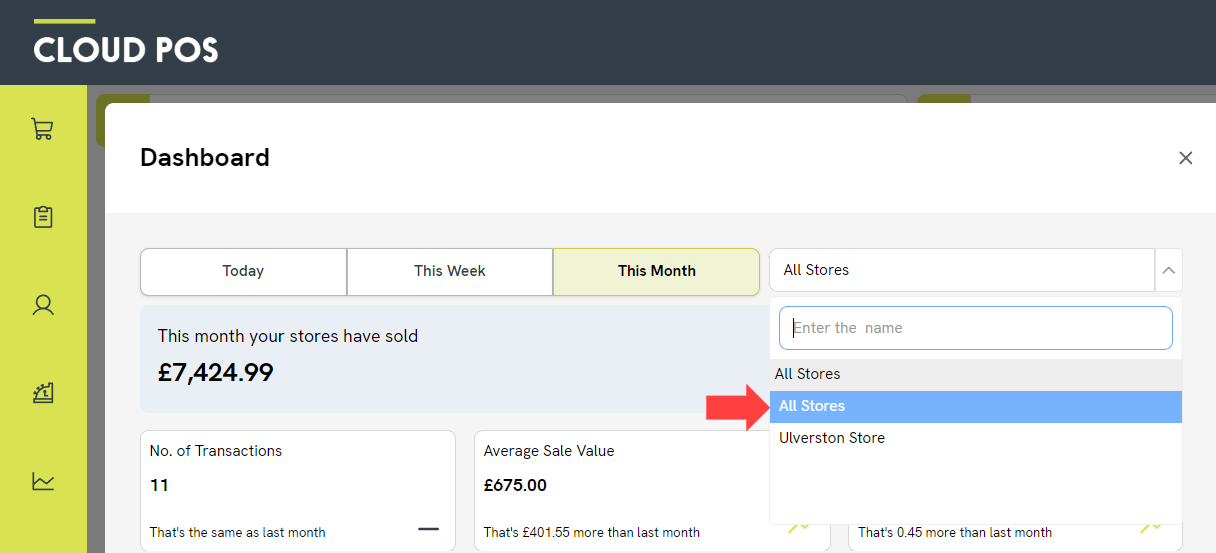
At the top of the Dashboard, there is a time period selector. There are three time periods to choose from:
- Today
- This Week
- This Month
On the right, there is a store selector. By default, the Dashboard will show sales data for your current store. If the security level for your user is set to ‘Administrator’, you can also choose to view sales data for all stores (locations) in your Cloud POS group:
The Dashboard then presents you with some summary data:

- This [month] you have sold: This shows the total value of your sales during the chosen period, with any returns deducted. This is your revenue figure including tax.
- No. of Transactions: This shows the total number of transactions that have been completed during your chosen time period. This includes return transactions, where items have been refunded or exchanged. It does not include creating a customer order or quote and taking a deposit, as no items will be selected for pick-up at this stage.
- Average Sale Value: This figure is calculated by dividing the total sales figure ('This [month] you have sold') by the No. of Transactions.
- Items per Transaction: This figure is calculated by dividing the total quantity of items sold by the No. of Transactions. Please note any items with a 0.00 price are excluded from this calculation.
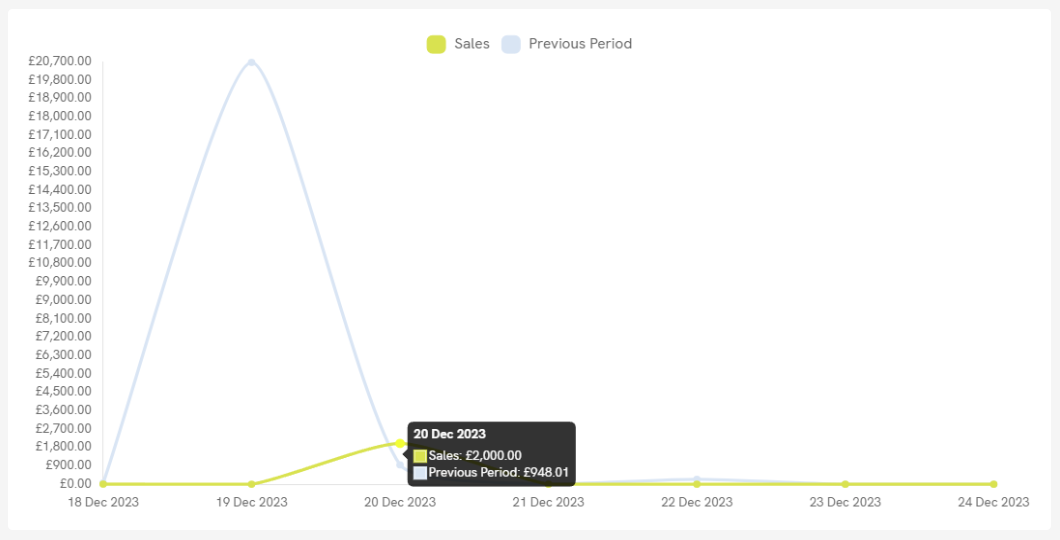
Below the summary data, the Dashboard shows a graph of the sales data:

The green line shows the sales in your chosen time period. The blue line shows the previous time period (for example, the previous month, week or day).
If you are viewing ‘This Week’ or ‘This Month’, the sales are shown per day. If you are viewing ‘Today’, the sales are shown by hour.
You can place your cursor on a data point to view the exact sales totals:
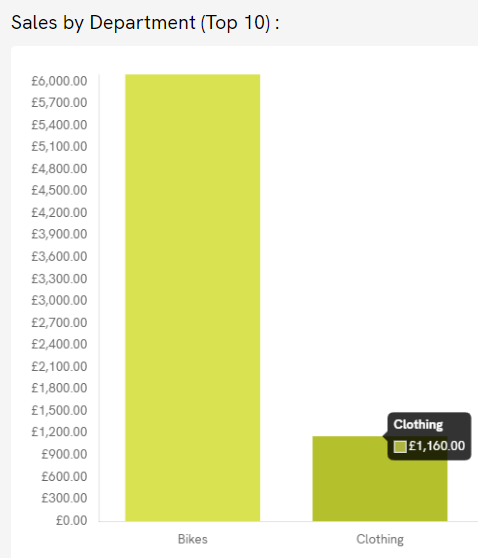
Finally, there is a department comparison at the bottom of the Dashboard:

This shows your sales organised by the Department of the items, as set in the Cloud POS Back Office.
Again, you can place your cursor on one of the totals to see the exact total:
Frequently Asked Questions
Why isn't the Dashboard showing in my menu?
The Dashboard is restricted by security level.
Three security levels can view the Dashboard: Administrator, Back Office, Supervisor Cashier
Two security levels cannot view the Dashboard: Full Cashier, Cashier
For more guidance on security levels, please refer to the following article: Managing Cashiers // Security Levels Explained
Are there any items that are not included in the Dashboard statistics?
Any item with ‘LOYALTY’ in the Item Lookup Code will not be included in the Dashboard statistics.
Also, any item with a price of 0.00 will be excluded when calculating the ‘Items per Transaction’ figure.
